Comparison of search traffic for your site and similar sites
Yandex.Webmaster collects and analyzes statistics on search queries that brought visitors to your site from search results. The data source is search. This data is used to generate a report that allows you to compare your site's search traffic with similar sites for the same period of time.
Sites are grouped based on the topic.
- Select the subject for your site.
- Set the time period you want to view the statistics for. By default, it is set to one month.
The report shows statistics for your website and a group of similar sites in the selected category.
How indicators are calculated
The report contains two indicators: the average number of clicks for your site and for a group of similar sites. The data is calculated for the chosen time period by the so-called report points. The report point is a day, week, or month, depending on how detailed the report is. For each point, the number of clicks is counted. The first point in the report is the first time period when the traffic to your site and similar sites was recorded. For example, if the level of detail is by day, the first point is the first day for which Yandex.Webmaster has the click data.
Search traffic is characterised by average indicators. This provides a general idea about the dynamics of site traffic from search queries.
To calculate the indicators, the number of clicks at each report point is divided by the number of clicks at the first point. As a result, the first point's indicator is always equal to one.
In some cases, the number of clicks in the table differs from the numbers in the graph. For example, if the following parameters are chosen at the same time:
- Incomplete time interval, such as September, October, and three days in November.
- Detail level is a week or month.
In this case, the graph shows only the selected time interval. In the table, the interval is supplemented with time intervals based on the level of detail.
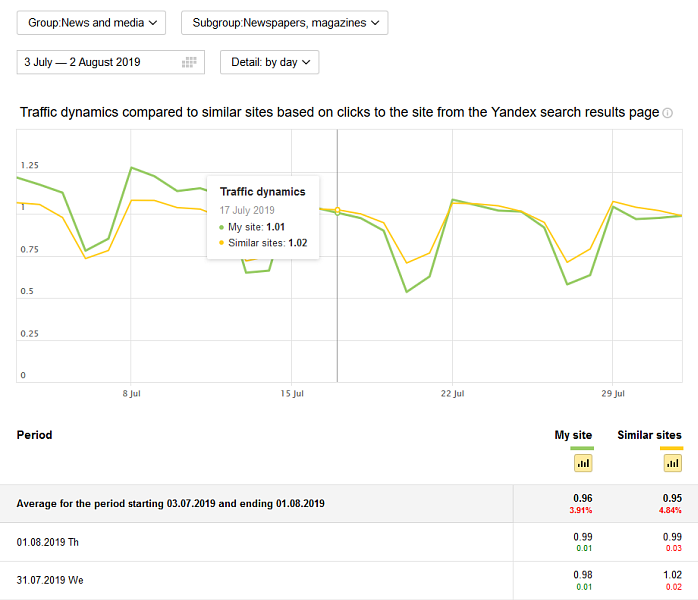
The Traffic dynamics line shows the average number of clicks per period. Percentage indicators show the dynamics of search traffic compared to the previous period. The increase in the indicator for the selected period is shown in green, and the decrease in red. The difference in numbers is calculated as compared to the previous period..
Data might be missing from the report if the Yandex.Webmaster database contains insufficient data to make the calculations.
Interpreting report data
You can use the report to see whether the site changes have affected the dynamics of traffic coming from the search results.
For example, you noticed that the traffic dropped over the last month. If theMy site line and Similar sites line change similarly over a time period, it's likely that the decline in traffic is not related to changes on the site. Seasonal changes might be one of the factors involved.
- Lack of informational value or missing Description meta tag.
- Violations on the site.
You can check for these reasons on the Troubleshooting page in Yandex.Webmaster.
